How to Predict Which B2B Accounts Will Churn Before Renewal
A technical blueprint for B2B churn prediction. The architectural problems are class imbalance and overlapping feature distributions, not algorithm choice, and classical algorithms on well-prepared data beat sophisticated models on raw logs. Separate involuntary churn driven by failed payments from disengagement, or the model fires rescue plays at expired credit cards. The output should be a calibrated probability attached to revenue, not a flag.
This article is for informational purposes only and does not constitute financial, tax, or legal advice. Consult a qualified professional for guidance specific to your situation.
Reviewed for financial accuracy by the Startup Finance Guide editorial team. Our editors cross-reference all claims against platform documentation, pricing pages, and primary regulatory sources. Last reviewed: November 2, 2026.
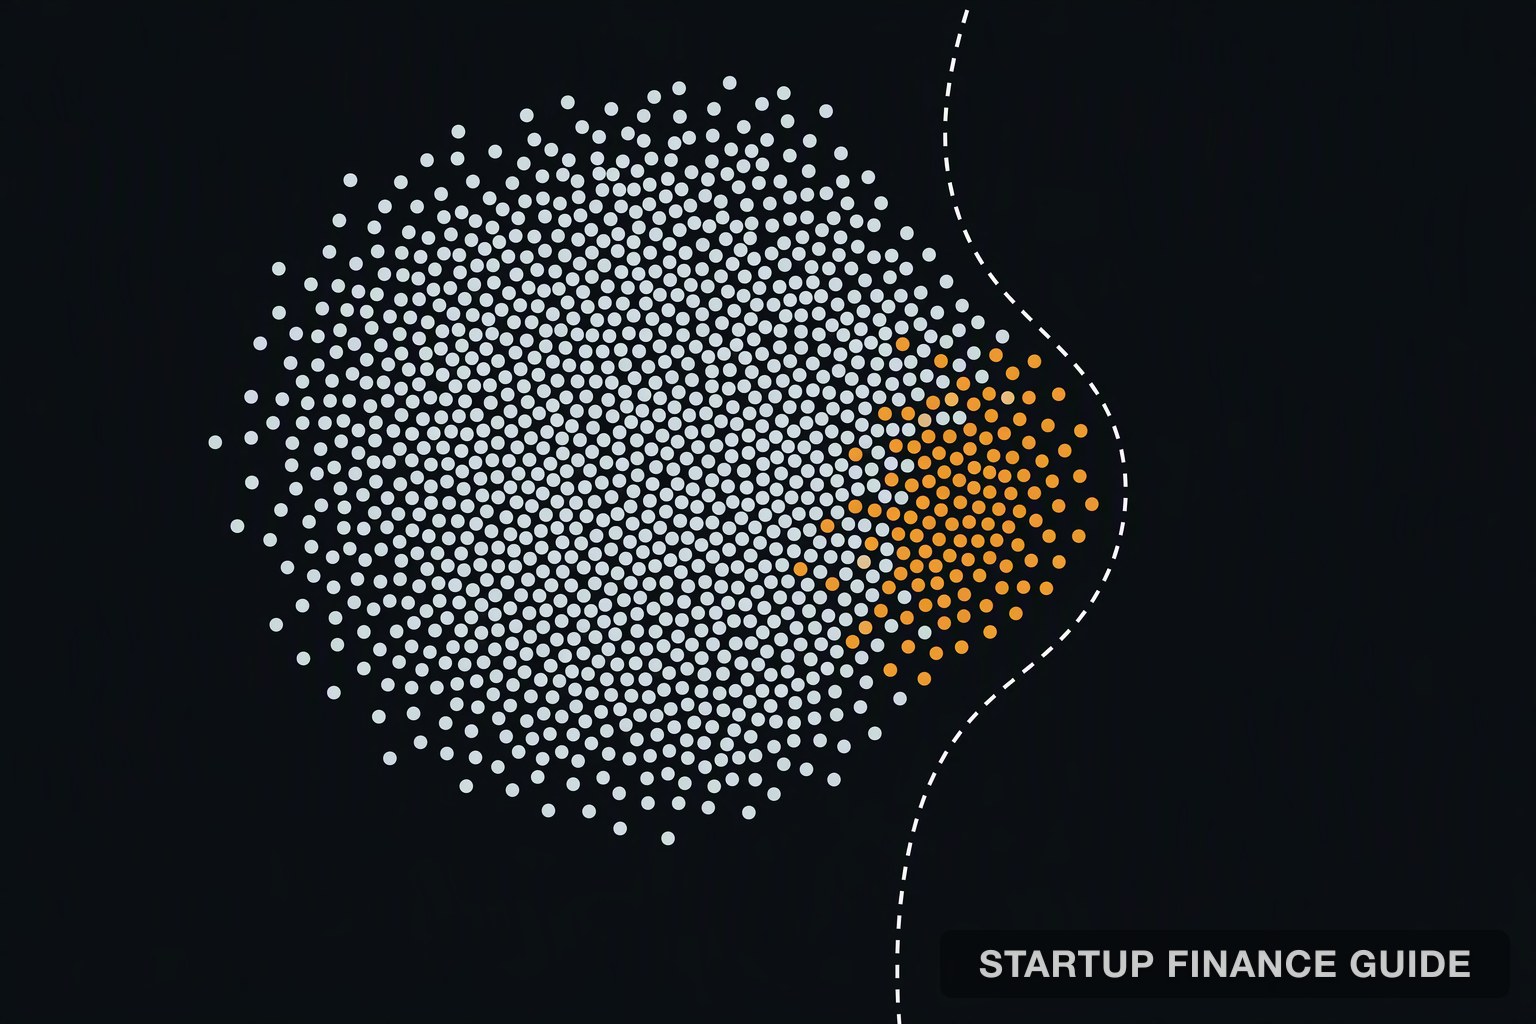
Predicting which B2B accounts will churn before renewal is a data problem before it is a modelling problem, and two specific conditions break most attempts. Churners are usually under 10% of the population, so a classifier optimising for accuracy learns to predict "renews" and is right most of the time. Worse, churner and healthy-account feature distributions overlap: login cadence and ticket volume look much the same right up to the exit. Fix those two things and ordinary algorithms work well. Skip them and no amount of model sophistication helps.
The practical output is not a churn flag. It is a calibrated probability attached to a dollar figure, which is what lets a CS team work the list in the right order.
Key takeaways
- Class imbalance and feature overlap are the architectural problems. Everything else is downstream of them.
- Oversampling with SMOTE on overlapping data generates synthetic points that cross into the majority region, contaminating both classes. GAN-based hybrid sampling combined with cost-sensitive weighting handles this better: the CostLearnGAN paper in PeerJ Computer Science reports an average mean rank of 1.44 across its evaluation metrics.
- Product usage is a leading indicator; CRM records are lagging ones. Structure usage by recency, granularity and the user's expertise tier rather than counting logins.
- Separate involuntary churn from disengagement. Failed payments are a meaningful share of B2B SaaS churn, and a model that mixes them fires rescue plays at expired credit cards.
- Put a human gate in front of automated action on high-value accounts. Telemetry records what happened, never why.
Why standard classifiers fail here
| Condition | What a standard classifier does | What is needed |
|---|---|---|
| Churners under 10% of accounts | Optimises for the majority class and ignores minority errors | Hybrid oversampling that synthesises realistic churner profiles rather than duplicating noise |
| Overlapping feature distributions | Draws a boundary that bleeds into the opposing region | Cost-sensitive learning that penalises false negatives in proportion to contract value |
| Nonlinear product interactions | SMOTE's linear interpolation produces unrealistic samples | A generator that learns the actual feature distribution |
| The overlap problem is the one teams underestimate. A churner's usage profile frequently looks like a healthy account's until very late, which is why adding more features rarely helps and better-structured features do. |
Engineering leading indicators
Stop treating a login as a binary event. Three dimensions make usage predictive:
- Timing: recency of deep feature adoption, not cumulative counts. An account that last built a report 40 days ago is a different proposition from one averaging 40 days between reports.
- Granularity: the specific features tied to renewal, rather than overall activity. Aggregate usage hides the signal.
- Expertise tier: who stopped. A power user who no longer builds advanced reports is a sharper alarm than a casual viewer who never went past the dashboard, and an aggregate metric treats them identically.
Support history is a weaker signal than most teams assume, because the accounts heading for the door often stop raising tickets rather than raising more. Silence is not satisfaction.
Handling imbalance without wrecking the data
Three techniques in sequence:
- Do not use SMOTE alone on overlapping data. It forces synthetic points across the class boundary and contaminates both sides.
- Generate, then clean. A GAN trained to produce plausible churner profiles, followed by edited-nearest-neighbour or Tomek-links undersampling to remove the overlap it creates.
- Weight by cost. Layer a cost-sensitive function on the resampled set so misclassifying a churner is penalised in proportion to that account's contract value. This is the step that converts a statistics exercise into something a revenue team can use.
The CostLearnGAN work in PeerJ Computer Science pairs tabular GAN-based hybrid sampling with cost-sensitive learning at both the data and algorithm levels, reporting an average mean rank of 1.44 across its evaluation metrics against comparison methods. Treat that as directional evidence for the approach rather than a promise about your data.
Choosing an algorithm
In this order, for most teams:
- Logistic regression when interpretability is non-negotiable and you have to explain each prediction to a CS leader in plain coefficients. It performs respectably once the imbalance is corrected, which is the point: the resampling does the heavy lifting.
- Random forest as the general-purpose baseline. It handles nonlinear interactions between usage timing and adoption events without deep tuning.
- Gradient boosting when the dataset is large enough to justify it and you want maximum lift, paired with cost-sensitive weighting.
The ranking matters less than the preparation. Classical algorithms on well-engineered, properly balanced data beat sophisticated models on raw logs. That is the most useful finding in this literature for a team without a data science function.
Separating involuntary churn
Involuntary churn, driven by failed payments, is a substantial share of B2B SaaS churn and runs higher in monthly-billing businesses with lower average revenue per account. It also has nothing to do with satisfaction.
Model it separately. An account with healthy usage and a card expiring in seven days needs a billing email, not a save play, and mixing the two teaches your model that healthy usage predicts churn.
Operationalising the score
A probability living in a notebook while the CSM prepares a QBR in the CRM is worth nothing. Four sources have to land on one account record: CRM touchpoints, support ticket sentiment, billing milestones and the usage features above.
The output should be a portfolio view sorted by risk-adjusted revenue exposure rather than by score. Platforms such as Quivly build this unified record by combining product usage, CRM, billing and support data, and surface the recommendation alongside its reasoning so a person can act on it. Our guide to tools that integrate customer data to prevent churn compares the options for assembling that record.
The hardest part in practice is billing. Usage and CRM data are usually accessible; billing often sits behind a different team and a different system, and it is the source that distinguishes the two kinds of churn.
The human gate
A model that is 95% accurate fails hardest where it costs most, because the errors land on high-value accounts where an automated save play can disrupt a renewal conversation a CSM has been steering for months.
Build a verification queue for high-value and early-stage accounts: a time-bound prompt naming the account, the threshold it crossed and when, requiring a confirm or dismiss with evidence. Feed those decisions back, because a CSM dismissing five alerts on accounts that later renew is telling the model something. And throttle the automation when the false-positive rate climbs, or the queue becomes something people clear without reading.
The reason this gate exists is simple: telemetry saw the usage drop, but only the human knew the power user went on parental leave.
From score to action
Each risk tier gets one predefined playbook, decided in advance so nobody interprets the score in the moment.
- Low adoption: feature adoption falls below a floor. Open scheduling for additional training automatically.
- Support friction: unresolved tickets spike inside 72 hours. Escalate to product, and have a senior CSM send a personal note the same day.
- Commercial risk: a payment failure on an account already showing declining usage. Pause survey sends and route to RevOps for an out-of-cycle contract review.
Any step pending for 24 hours escalates automatically. Each month, track saves per playbook and retire the ones that move nothing. Our guide to identifying at-risk customers covers that operating rhythm in more detail, and measuring AI agent ROI covers proving it worked.
Limitations
The modelling guidance here summarises published academic work on imbalanced and overlapped churn data, and results on a benchmark dataset are not a prediction about yours. We could not verify one robustness figure that circulates alongside the CostLearnGAN results, so it is not quoted here; the mean rank is. Figures on the share of churn that is involuntary come from vendor research rather than peer-reviewed work and vary widely by billing model. Nothing here has been implemented and measured by us end to end.
Frequently asked questions
How much data is needed before a model is worth building?
Enough churn events to learn from, which in practice means a few hundred at minimum. Below that, a well-chosen rule set beats a model, and the honest answer for most early-stage companies is to start with rules.
Is a probability better than a health score?
Only if it is calibrated and tied to revenue. An uncalibrated probability is a health score with more decimal places. The test is whether accounts scored at 0.7 churn roughly 70% of the time.
Why not just use the vendor's built-in scoring?
For many teams that is the right call. Build your own when your churn pattern is unusual, when you have the data engineering to maintain it, or when you need to explain the mechanics to a board. Otherwise the maintenance burden outweighs the accuracy gain.
How far ahead can a model see?
Further for products used daily than for products used quarterly, because the signal is behavioural. Lengthen the prediction window and precision falls; everyone selling you a universal number is quoting their best case.
What breaks a working model?
A product change that alters what normal usage looks like, a pricing change that shifts the customer mix, and silent data pipeline failures. Review the model after any of the three, not on a calendar.
Conclusion
Treat imbalance and overlap as the architecture rather than as preprocessing, engineer usage features by timing, granularity and expertise, keep involuntary churn in its own model, and put a person in front of any automated action on an account worth saving.
Done in that order, ordinary algorithms produce a probability your team will trust. Done out of order, the most sophisticated model available will tell you an account was doomed two weeks after it stopped logging in, which you already knew.
Modelling guidance here summarises published academic work on imbalanced and overlapped churn data, and benchmark results are not a prediction about your data. One robustness figure that circulates alongside the cited results could not be verified and is not quoted.
How we built this guide: the sampling and cost-sensitive learning approach is drawn from peer-reviewed work in PeerJ Computer Science, with vendor-sourced figures labelled as such and unverifiable figures left out.
Last verified: 2026-11-02
Sources
- Optimized customer churn prediction using tabular GAN-based hybrid sampling and cost-sensitive learning | PeerJ Computer Science
- Optimized customer churn prediction | PubMed Central
- A GAN-based hybrid sampling method for imbalanced customer classification | Journal of Big Data
- Quivly
- Develop and automate churn prevention playbooks | Gainsight Community